
 Since the start of the global COVID-19 pandemic, retailers have faced new, unprecedented challenges — particularly as consumer demand and spending continues to evolve. And while some companies have experienced an overall increase in sales, such as those in the grocery business, it remains difficult for retailers of all sizes to maximize the performance of their source-to-pay cycle.
This is especially true when it comes to tracking the success of rebates, promotions and discounts. These increasingly complex programs provide a much-needed source of revenue and customer engagement, while also opening the door to potential profit leakage.
A True Net Cost (TNC) analysis is a simple yet effective tool for retailers to scrutinize their costs and margins. This analysis offers a deeper, more accurate view into the effectiveness of vendor promotions, and examines how increased sales can even mask root cause issues within the source-to-pay cycle.
Accurately Accounting for Direct and Indirect Costs
Retailer promotions and discounts are constantly evolving and adapting. Oftentimes, retailers enter into hundreds — perhaps thousands — of vendor agreements, all of which have their own different time frames and scope, including invoice allowances, billbacks, scan-downs, flat funding and so on. Thus, accurate tracking and accounting of indirect spend and promotional application is invaluable and can have a consequential impact on the TNC of a product.
Without the right data model or platform, it is difficult to accurately calculate individual funding and margin at the category, vendor and product levels. Pulling all of the data into a TNC analysis, however, provides retailers a deeper view into how a particular promotion impacts costs, sales and margins, so they can leverage a mix of promotions and regular-priced items at the right timing.
Further, a TNC analysis shows which categories and vendors retailers are deriving the most value from. This analysis also allows retailers to conduct year-over-year comparisons and pinpoint potential funding trends.
Understanding TNC Use Cases
Once retailers have full visibility and access to all products’ sales, cost, promotions and margin performance, they can accurately measure and compare the impact of each individual program. This also allows retailers to forecast promotion results based on past consumer behaviors.
Consider this example: At the beginning of the COVID-19 pandemic, consumers rushed to stores and stockpiled food, toilet paper, cleaning supplies and other essential goods. This caused a significant spike in sales — an almost 23% increase over the first five periods of 2020 versus the same periods in 2019.
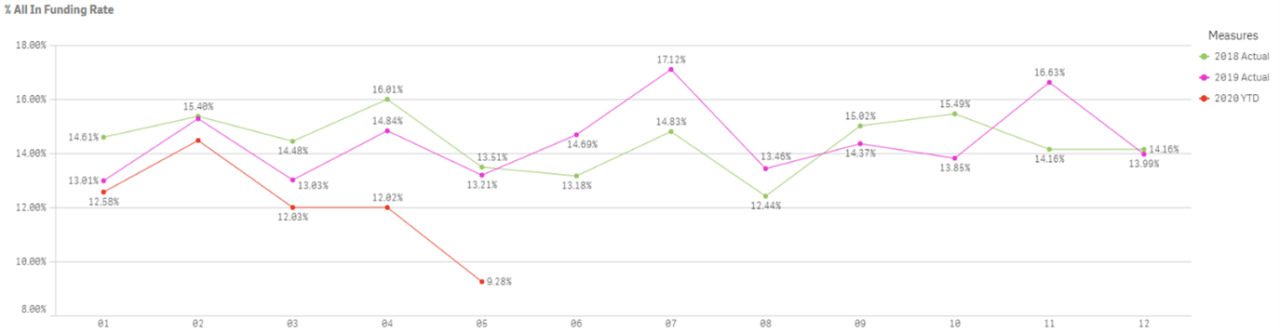
As sales increased, so did overall promotional funding. However, although the overall dollar value of the promotional funding increased year over year, the rate was much lower than the increase in sales. So while on the surface an increase in sales may appear wholly positive, the lag in promotional funding increase shows there may be underlying inefficiencies or operational gaps.
The following graph offers an introductory view into funding that is critical in comparing year-over-year funding rates for each product, vendor and category. Whereas dramatic changes in sales can hide actual changes at the unit or dollar amount level, accurate insight into true cost and margin can highlight where to focus attention.
There are a variety of ways to highlight problem categories and vendors, but a quadrant chart is a highly visual, easy-to-explain tool to highlight key areas of interest. The below graph demonstrates the relative rate change of each category from one year to the next, regardless of any large shift in sales.
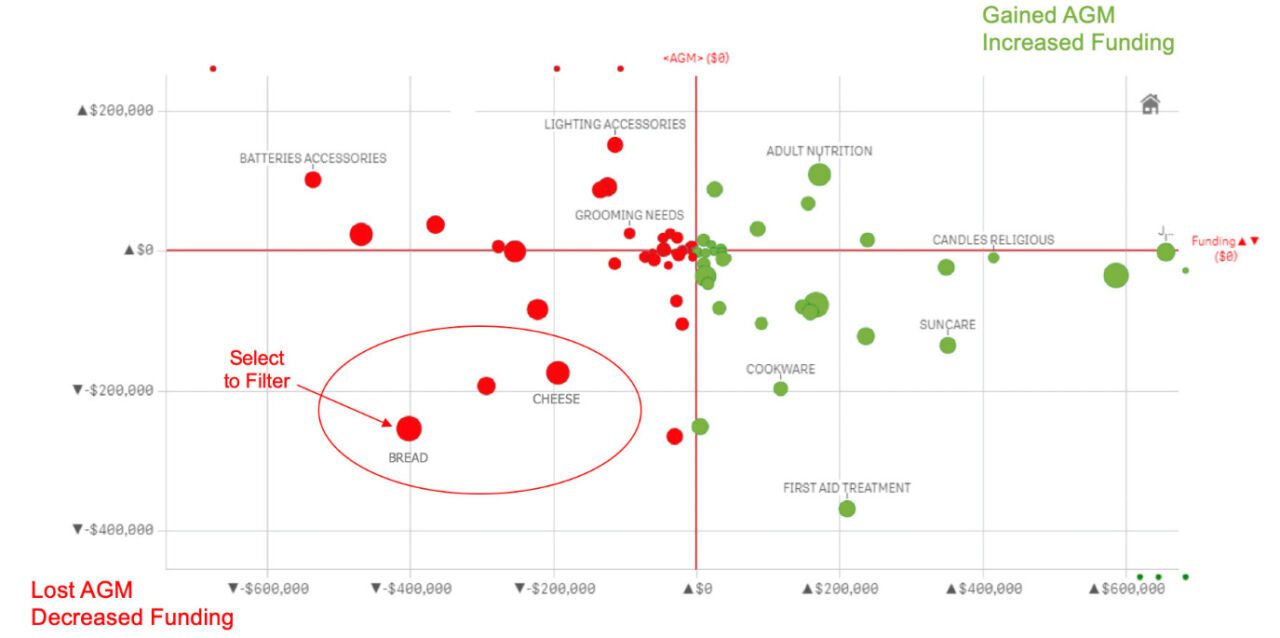
The categories in green represent products with a higher margin rate than the year before. In red, lower margin rates. The top side of the graph represents promotional funding rates higher than the year before, while below represents lower funding rates. The circle size represents the size of sales.
It is readily apparent from the TNC analysis that two large categories in Quadrant 3 saw a decrease in both funding and margin rates. Using this information, retailers can explore which vendors and UPCs are included in these categories to identify exactly who or what is contributing to these changes.
Where Do Retailers Go From Here?
Consumer buying habits, sales strategies, promotions and the retail industry as a whole are experiencing a period of rapid change. Shoppers are more digitally enabled than ever before, and retailers’ increasing use of technology to engage them only adds to the complexity of their operations. While a TNC analysis is no silver bullet, it does provide insight into what promotions are working and what are not, particularly during a time of such great uncertainty.
Jin Ro, Chief Analytics Officer, joined PRGX in April 2019 and is responsible for generating actionable insights for customers that aid in decision making while utilizing the latest techniques in the field of data science. Ro has more than 15 years of experience in the advanced analytics space, with a successful track record of building award-winning source-to-pay and analytics platforms with Accenture, McKesson and Seal Software. Ro holds a Bachelor of Science Degree in Architecture and Urban Planning from Princeton University and a Master of Business Administration Degree with an emphasis in Enterprise Analytics from Drexel University.